This article was published in Pet Food Processing’s 2023 Buyers Guide. Read it and other articles from this issue in the digital edition of the Buyers Guide here.
In 2020, the US pet care industry surpassed the $100 billion sales milestone, and years later has showed no signs of slowing down. According to the American Pet Products Association’s (APPA) State of the Industry data, total pet industry sales topped $136.8 billion in 2022, representing an increase of 10.8% from 2021. Bloomberg Intelligence (BI) predicts that the US pet market will achieve $195.6 billion in sales by 2030.
“Pet spending in 2022 was up nearly 11% from the previous year,” said Peter Scott, president and chief executive officer of APPA, following the release of the 2022 State of the Industry data. “While we outperformed our 2022 forecast, we know this increase can be attributed in large part to higher than anticipated inflation, and we expect spending will follow a similar trajectory and remain steady in 2023.”
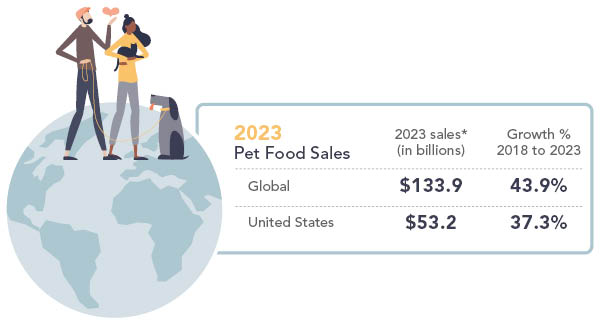 Sources: Euromonitor International; *2023 estimated year-end sales; Illustrations by ©VectorMine – stock.adobe.com
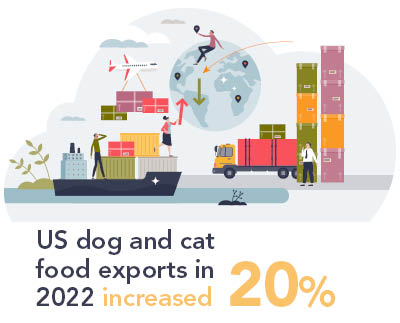
Globally, pet food sales are expected to grow to $133.9 billion in 2023, according to year-end estimates by market research provider Euromonitor International. In the United States, pet food and treat sales are expected to reach $53.2 billion by the end of 2023. Dog and cat food exports increased 20% from $2.05 billion in 2021 to $2.4 billion in 2022, according to the US Department of Agriculture’s Global Agricultural Trade System.
While food and treats still represent the highest spend category for pet parents, other pet-related products and services continue to make the list of necessary expenses. The APPA’s 2022 State of the Industry report showed:
- $58.1 billion was spent on pet food and treats (a 16.2% increase from 2021)
- $35.9 billion was spent on veterinary care and product sales (a 4.7% increase over 2021)
- $31.5 billion was spent on pet supplies, live animals and OTC medication (a 5.7% increase from 2021)
- $11.4 billion was spent on other services, including grooming, dog walking and boarding (a 20% increase over 2021)
“Overall, we are excited to report all signs continue to point to the strength of the industry,” Scott said.
According to Chicago-based market research firm Circana, all pet food formats saw growth between June 2022 and June 2023.
Dry dog and cat food sales both had strong years with increased growth from prior years. In the 52 weeks ended June 18, 2023, dry dog food sales increased 19.7% (growth between 2021 and 2022 was 12.3%). Dry cat food sales increased 21.8% after experiencing a 13.2% increase between 2021 and 2022. Nestlé Purina and Mars Petcare are the top two companies leading the dry dog food category, while Nestlé Purina and Big Heart Pet Brands lead the dry cat food category.
Wet dog and cat food sales saw 12.5% and 14.6% sales increases, respectively, compared to the year prior.
While the refrigerated/frozen category in both dog and cat food is considerably smaller, the increase in category sales was strong once again with a 31.7% increase in dog food and a 19.4% increase on the cat side. The category also saw solid sales growth between 2021 and 2022, with increases of 35.8% and 22.5% in dog food and cat food, respectively.
The treat category continues to produce strong sales both on the dog and cat side. Dog treats increased 12.8% from $3.54 billion in 2022 to $3.95 billion in 2023, with Big Heart Pet Brands and private label brands leading the category. Cat treats saw slightly higher growth with a 15.1% increase from $1.12 billion in 2021 sales to $1.27 billion in 2023, with Mars Petcare and Nestlé Purina in the top two spots.
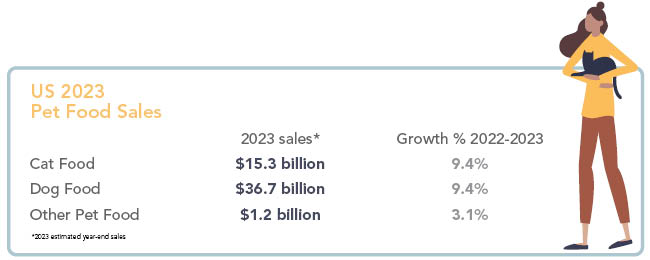 Source: Euromonitor International; Illustration by ©VectorMine – stock.adobe.com
Pet owners
According to the 2023-2024 APPA National Pet Owners Survey, 66% of US households own at least one pet, which equates to 86.9 million households. This pet ownership is now reflected equally among younger and older generations of pet owners. For the first time, APPA reported, the number of Gen Z and Millennial pet owners equals the number of Gen X and Baby Boomer pet parents.
“While pet ownership has normalized somewhat, the most recent version of the National Pet Owners Survey reveals some very interesting trends that will have significant implications for the industry this year and beyond,” said Anne Ferrante, senior vice president of member relations and business development at APPA. “This includes differences in pet ownership by generation, the effect of the economy on spending, shifts in where people are acquiring pets, trending product categories and more.”
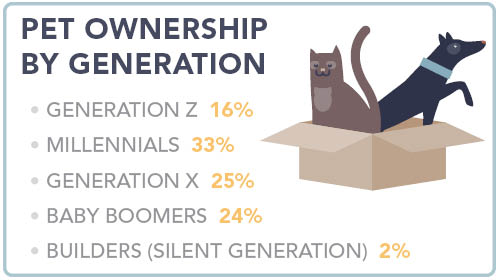
Pet ownership among the two youngest generations rose steadily from 2018 to 2022. According to APPA, 11% of Gen Z owned a pet in 2018, which rose to 14% in 2020 and 16% in 2022. Additionally, 31% of Millennials owned a pet in 2018, which rose to 32% in 2020 and 33% in 2022.
 Source: American Pet Products Association, “2023-2024 APPA National Pet Owners Survey”; Illustration by ©VectorMine – stock.adobe.com
For older generations, pet ownership has fluctuated over this period. For example, 26% of Gen X owned a pet in 2018, which fell to 24% in 2020, but then rose slightly in 2022 to 25%. Roughly 29% of Baby Boomers owned a pet in 2018, which declined slightly to 27% in 2020 and fell to 24% in 2022. Pet ownership has continued to fall among the oldest generation — Builders (or the Silent Generation) — with 4% owning a pet in 2018, 3% in 2020 and 2% in 2022, according to APPA.
Approximately 36% of Millennial pet parents own a dog or cat. For Gen Z, 17% own a dog and 15% own cats. Among Gen X, 24% own dogs and 25% own cats. Additionally, 22% of Baby Boomers own dogs and 23% own cats.
Though Millennials and Gen Zers are beginning to dominate the pet space, they are spending less compared to the older generations, according to MarketWatch. On average, Gen X pet parents spend the most on their pets annually at $949, followed by Baby Boomers who spend $842. Next in line are Millennials spending $679 annually, followed by the Silent Generation at $495, and Gen Zers only spending $369 per year.
Over the past 10 years, US pet parents increased the amount of money they spent on their pets annually — from $631 in 2011 to $969 in 2021, a 54% increase, according to MarketWatch. Despite this, the percentage of income pet owners dedicated to their pets has dropped to 0.88% in 2021, from an average of 0.97% in 2017.
By generation, Baby Boomers and the Silent Generation dedicate more of their income toward their pets, spending about 1.07% and 1.18% of their income on pet products, respectively. Gen Zers spend 0.83% of their income on their pets, Gen Xers spend 0.81%, and Millennials spend the least amount of their income (0.74%) on their pets.
These generational differences are most likely due to the older generations having a higher net worth accumulated, whereas younger generations, like Gen Zers, are just starting out on their own and have considerably lower net worth.
Where to shop?
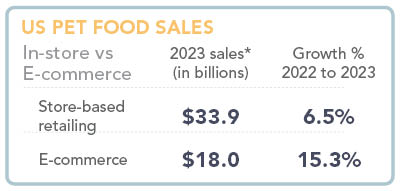
Despite the many options of where pet parents can shop for pet food and treats, 38% of pet owners typically purchase pet products in person at brick-and-mortar stores, compared to 34% who shop online, according to APPA’s National Pet Owners Survey. However, many shoppers (12%) report that they browse for products online but then shop in-store, while 7% browse in-store and then buy online.
According to APPA, 90% of pet owners have made some type of online pet product purchase over the last 12 months. Food and treats are two popular pet product categories for online purchasing, with 80% of pet owners purchasing their pets’ food online and 76% purchasing treats online in 2022.
According to APPA, 42% of pet owners who purchase pet food online have the products shipped directly to their homes, while 46% pick them up inside the store and the remaining 13% pick them up curbside. Similarly, for those who purchase treats online, 39% have them shipped to their homes, 49% pick them up inside the store, and 13% pick them up curbside.
 Source: Euromonitor International; *2023 estimated year-end sales
Subscription-based purchasing is a convenient alternative for online pet product shoppers with 28% of pet food shoppers utilizing such services in 2022, down from 31% in 2020, and 18% of pet treat consumers using this online ordering service in 2022.
In 2022, 50% of pet owners claimed their online pet product purchasing habits stayed the same over the last 12 months, while 42% said they made more online purchases and 8% said they made fewer. Looking ahead, 31% of pet owners said they plan to utilize online purchasing with direct home delivery more, while 19% said they plan to order online and pick up inside the store more frequently, and 16% plan to leverage curbside pickup more often.
Regardless of where today’s pet parents purchase their pet food and treats, pet owners learn of new products and research the products they’re interested in both in-store and online. According to APPA, 52% of pet owners in 2022 learned about new products by browsing the pet food aisle and 45% of pet parents researched new products online. Social media (38%), friends and relatives (38%) and TV ads (35%) are also sources of new product awareness. Pet parents are least likely to consult pet store personnel (28%) or veterinarians (27%) for information on new products.
Fifty percent of pet owners go to pet product company websites to find information about new products, which is up from 45% in 2020. Forty-five percent learn from YouTube, 43% from retailer websites, 42% from Facebook pages, 33% from product review sites, 32% from Instagram, 25% from TikTok, 18% from Twitter or Pinterest, 12% from blogs, and 11% from Snapchat.
Demand for treats
While pet food is the larger ticket item for pet parents, pet treats are a growing segment of the industry. The products in this category for dogs and cats feature emerging ingredients, functional attributes and a variety of formats. According to Packaged Facts, pet treat sales topped $11 billion in 2022, including both brick-and-mortar and online sales. E-commerce held the largest share of this market at 34% of sales.
While dog treats still make up the majority of total treat sales at 78%, cat treat sales continue to grow at a quicker pace. Indulgent treats account for 36% of total pet treat sales, while rawhide or long-lasting chews, functional treats and dental chews make up smaller shares of the category.
“Demand for more cat-specific treats is growing every year, presenting more opportunities for marketers willing to expand their offerings to embrace this ‘second-class pet,’” wrote Shannon Landry Brown, brand manager for pet market research at Packaged Facts.
According to Packaged Facts, the top two trends fueling the US pet treat market are humanization and health and wellness.
The humanization of pets and the increase in preventive pet health care have led to a rise in products touting a variety of functional benefits including dental health, weight management and life stage-specific benefits. Pet parents are also seeking pet treats that mirror their own dietary demands, which often includes products without artificial flavors, colors and preservatives, in addition to other functional health benefits that pet parents might be looking for in their own products.
“Not only do pet owners use treats to encourage good behavior (for training purposes, for example), they use them to express feelings of affection; ‘treat time’ has become a way for pet owners to show their pets just how much they mean to them,” Brown added.
Investing in the future
All pet food industry stakeholders remain optimistic despite continued challenges throughout the manufacturing industry. This optimism can be seen through ongoing investments in facility expansions and new plant construction over the past year. The sustained growth in all segments of the industry from ingredient and equipment suppliers to the pet food and treatment manufacturing operations themselves shows the continued confidence in this growing industry.
 Source: USDA Global Agricultural Trade System; Illustration by ©VectorMine – stock.adobe.com
Earlier in the year, Nestlé Purina PetCare announced plans to construct a new manufacturing facility in Clermont County, Ohio. Freshpet broke ground on an expansion of its pet food manufacturing facility in Ennis, Texas, which will add 200,000 square feet to the plant. Blue Buffalo also broke ground on a plant expansion in March. Its Richmond, Ind., facility will also be expanded to add 169,000 square feet of processing and warehouse space.
Leading industry ingredient suppliers also made substantial investments in operations to further support the expanding industry. ADM invested $30 million in a new production plant in Valencia, Spain, to produce probiotic and postbiotic ingredients. Scoular broke ground on a $20 million expansion of its feed blending facility in Idaho to help meet custom feed needs for dairy and beef producers. At the beginning of May, DSM announced plans to construct a premix plant for the pet food industry in Tonganoxie, Kan. In July, Kemin Nutrisurance cut the ribbon at its first wet pet food pilot plant.
These operational investments, and many others are detailed in our new construction summary “Scaling up supply” which starts on Page 21. These investments show how the pet food and treat industry, and the ancillary industries that support it, are doing their part to help meet evolving consumer demand.
According to BI, the global pet industry is currently worth $320 billion and is expected to reach $493 billion by 2030. If this 54% increase is to be reached, the pet food and treat industry will need to keep evolving its technologies, formulations, ingredient development and product innovations in order to fuel this anticipated growth.
Compare these trends and numbers to our 2022 State of the Industry report here, and keep up with the latest pet food trends on our Trends page.